DLSPH Researchers Map GTHA Traffic Air Pollution and its Changes over the Last 15 years
June 2/2023
By Allan McKee
Its’ Clean Air Day today (June 7)! How ironic it is that we are dealing with a thick blanket of haze from forest fires in Quebec – wiping out all the gains in air quality we should be celebrating today. Our record levels of air pollution remind us of how important clean air is. It’s also a reminder of how climate change is being felt close to home and of the work to be done to slow and stop climate change from getting worse. What we see today is what our already changed climate can do to increase forest fires and impact air quality virtually everywhere in Canada. But the changed climate and its impacts are heading towards worse conditions faster than expected with the Intergovernmental Panel on Climate Change recommended target of 1.5C warming now expected to be surpassed before the end of this decade.
There is reason for optimism though. We have made significant gains in air quality in the Greater Toronto and Hamilton Area (GTHA) and so we know it’s possible to have success. Researchers at the Canadian Urban Environmental Health Research Consortium (CANUE), an environmental data platform based at the Dalla Lana School of Public Health, have shown where air quality needs to improve in the Greater Toronto and Hamilton Area. Acting on this GTHA air pollution more through measures that also address greenhouse gas emissions and reduce inequities in exposures represents a big opportunity for public health improvement and progress on climate change mitigation
Priya Patel, a data scientist at CANUE, worked with Dr. Jeff Brook, CANUE Scientific Director and Associate Professor at the Dalla Lana School of Public Health and the Department of Chemical Engineering and Applied Chemistry, to map the most detailed picture yet of nitrogen dioxide (NO2) in the Greater Toronto and Hamilton Area. Such maps are routinely used in air pollution and health research, but this is the first such map for the whole GTHA with seasonal and annual trends covering 15 years, representing new air pollution information for nearly seven million Ontarians.
“We have made considerable progress in addressing NO2 pollution over the last decade and a half, and we should celebrate that success on Clean Air Day,” Brook says.
Prof. Jeffrey Brook
The detailed map is a major step forward in understanding where the risks of air pollution are greater and when because levels of NO2 show strong seasonal swings. With only 13 sites routinely monitoring NO2 across the GTHA, the model is able to fill in the gaps, mapping the distribution at a 30 m spatial resolution by using data from these 13 sites along with information on wind speed, road networks, industry, land use and other features of the built environment that contribute to spatial variability of air pollution. Monthly data can help home in on periods of exposure such as in prenatal and infancy that are critical windows in children’s early life development.
The map shows that the downtown cores of Toronto and Hamilton have elevated levels of NO2 because of traffic density and areas of freight and goods movement like 400-series highways, rail yards, warehouses, airports, and industrial emission sites are elevated. The main source of NO2 is combustion of fossil fuels.
“Most people know that if you live close to a major road, you will have higher exposures, but what surprised us was the degree to which exposures are also driven by proximity to freight transportation hubs,” says Patel. “The importance of communicating the health risks to vulnerable communities (especially on days like today) will grow increasingly important and should be considered alongside mitigative tactics to reduce air pollution and air pollution exposure.”
Knowing where exposures are elevated is significant for understanding the health risks of NO2. Dr. Brook was involved in an international systematic review of the health effects of traffic-related air pollution that was released in 2022 from the Health Effects Institute. The review showed that NO2, as an indicator of traffic-related air pollution or TRAP, was associated with a range of negative health outcomes including the onset of asthma in children and adults, respiratory infections in children, worsening heart disease, and death from multiple causes, but particularly cardiovascular complications. Certain populations, including older adults, children and people with respiratory conditions like asthma and chronic obstructive pulmonary disorder (COPD) are especially susceptible to the pollutant’s negative health outcomes, even for short periods of high levels which can exacerbate their symptoms.
Recognizing these health effects, in 2021 the World Health Organization dramatically cut its safe guideline for annual exposure to NO2 by 75% from 40 to 10 micrograms per cubic metre.
“Safe levels of NO2 are very low and more than half of Canadians live in areas above the new WHO Guideline, but some people are more exposed and more vulnerable to its health effects so reducing their exposure should be a priority from an equity and public health perspective,” Brook says. “We should recognize the past sizable reductions thanks to a range of policies, but there is more work to do, especially in light of the backsliding in air quality from forest fires.”
The model is the first step in an effort by CANUE to develop a new national dataset that researchers can use to investigate the health effects of NO2 or TRAP. With a high-resolution national model, CANUE will enable researchers to investigate exposures in communities without monitoring sites. The new GTHA maps, including an animation, will be available on the CANUE website. In the future, these data are expected to be available for researchers as part of a new release of national NO2 data. Those data will complement data on forest fire related exposures already available from CANUE.
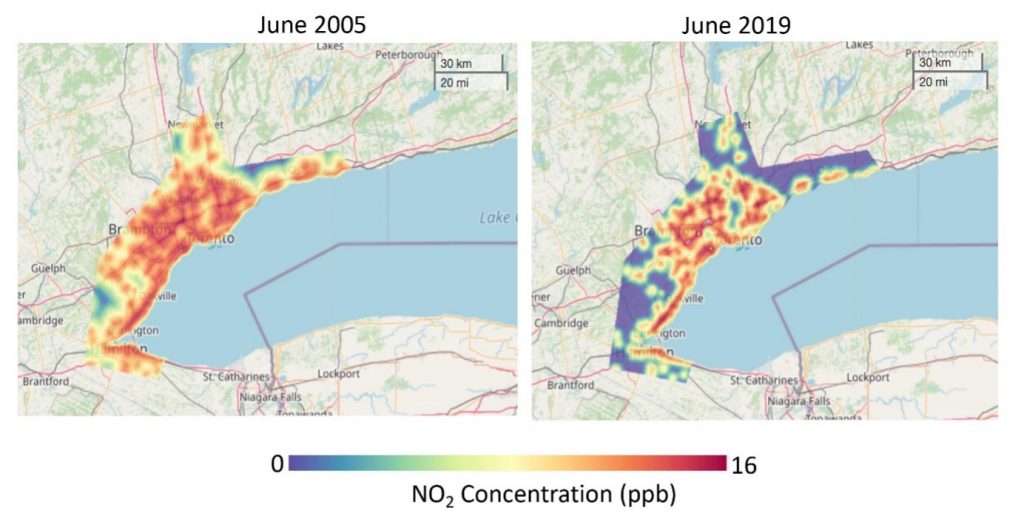
Clean Air Day, 15 years apart: Maps comparing NO2 exposure in June 2005 and June 2019 show that while significant reductions have been achieved, higher levels of exposure persist, particularly in the downtown cores and by busy transportation areas.